.NET Power Tip 5: Examining .NET Callstacks on Running Application with Sysinternals Process Explorer
This blog post shows how you can use Sysinternals Process Explorer to examine .NET Processes at runtime without installing any software on the machine:
- Look at managed call stacks
- Get performance info for CPU and GPU
- Check .NET performance counters
- Unlock Files
- See what assemblies are loaded and from where
- Find out the CLR version and GC flavor
Every now and then, you just want to know what an application is doing at a certain moment. The obvious to do would be to attach a debugger, such as the Visual Studio debugger, break the application and look at the call stacks.
However, there is a much easier possibility. Meet Process Explorer from Sysinternals.
For those not familiar, Process Explorer is a Windows tool that lets you look at the processes currently running on the system plus a lot of performance information. It works similar to the Windows Task Manager but offers a lot more. You can get it for free at:
or directly download it at: http://live.sysinternals.com/ProcExp.exe
What are the main benefits of using Process Explorer?
- It is free
- You don’t need to install it
- It has a really small footprint (2.5MB)
- SysAdmins love it, so it might already be on your target machine
- It shows processes in their hierarchical order
- You can customize the visible columns and add information about CPU, Memory, Image, etc…
- You can select a process by dragging the crosshair onto a window
- It shows you a lot of PER PROCESS information, such as:
- CPU Performance Graphs
- GPU Performance Graphs
- Information about the loaded image
- TCP/IP connections that the process is using
- Currently registered environment variables
- Security settings for the process
- I/O Counters for Disk and Network
- All the string values loaded into the image and its memory
- It can be used to unlock files, see here: http://www.12qw.ch/2013/09/tooltips-unlocking-files-with-sysinternals-process-monitor/
- It understands .NET
The last point is extremely important! It means that you can get a lot of information about your .NET processes from process explorer. Examples are:
Threads
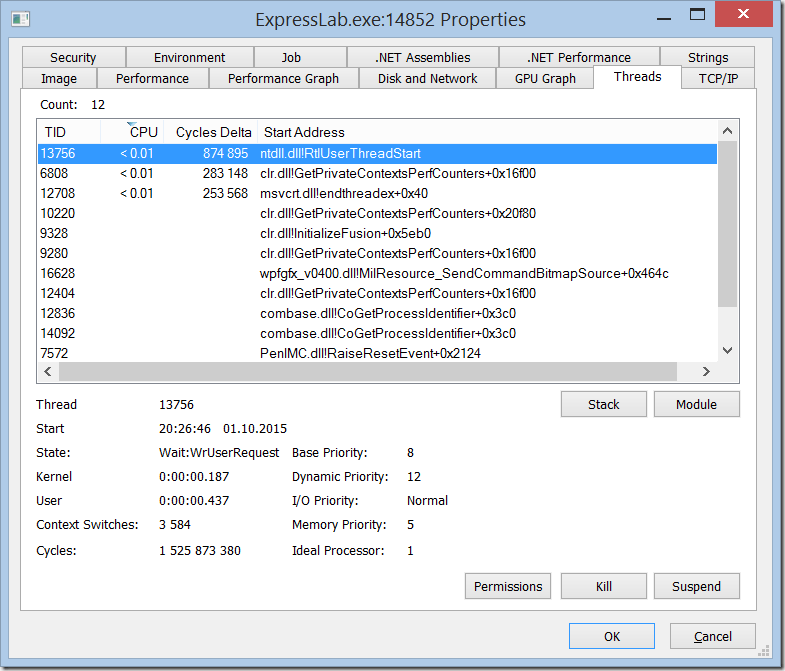
In the thread window you can see all the active threads, their TID, the module that they are executing and the CPU time per thread. By clicking on one of the threads you can look at the current call stack. If your version of Process Explorer is not too old, it will show transitions between managed and unmanaged code and you will see the methods from your .NET code in the callstacks. This will give you an idea about what the application is doing.
Note: In order for managed method names to show up correctly, you need to configure debug symbols according to the instructions in this link:
Thread Window:
.NET Assemblies
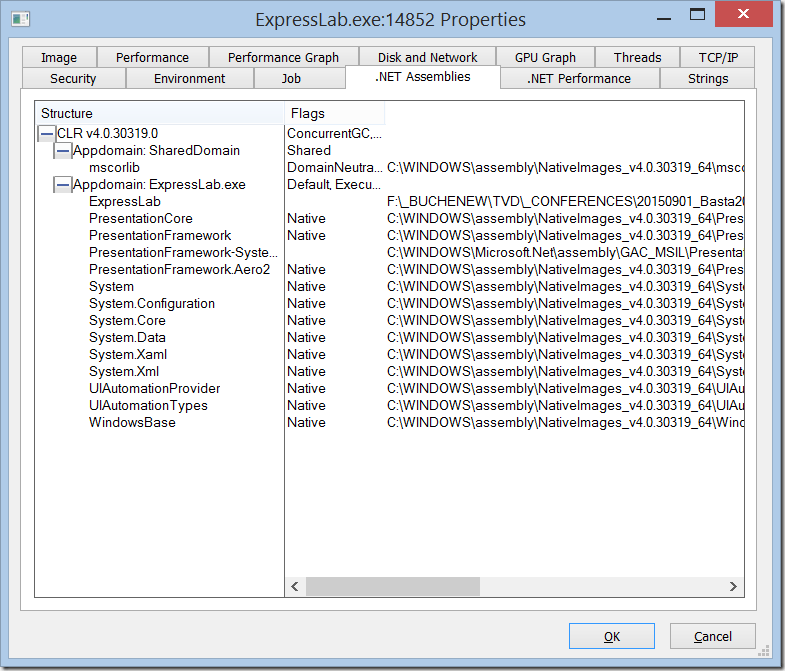
This window shows you:
- The version of the CLR that is used
- The flavor of the GC that is used
- The number of AppDomains loaded
- The Assemblies that have been loaded including
- The Type (native or managed)
- The full path to the file system
.NET Performance
This window shows the common .NET Performance Counters for categories such as CLR Memory, Exceptions, Data, etc.
Sysinternals Process Explorer is a very powerful tool that can help you understand your .NET applications even when running (or crashing, for that matter) on heavily guarded production machines.
Learn how to use it and always carry it with you like a Swiss army knife!


0 Comment